k8s部署Prometheus + node_exporter + Grafana + Alertmanager
👨🎓博主简介
🏅CSDN博客专家
🏅云计算领域优质创作者
🏅华为云开发者社区专家博主
🏅阿里云开发者社区专家博主
💊交流社区:运维交流社区 欢迎大家的加入!
🐋 希望大家多多支持,我们一起进步!😄
🎉如果文章对你有帮助的话,欢迎 点赞 👍🏻 评论 💬 收藏 ⭐️ 加关注+💗
一、前言
需提前搭建好Kubernetes集群,可参考如下文章:
| 文章标题 | 文章链接 |
|---|---|
| K8s单机架构部署 | https://liucy.blog.csdn.net/article/details/120742911 |
| K8S 二进制集群搭建(一主两从) | https://liucy.blog.csdn.net/article/details/151709127 |
| kubeadm搭建k8s高可用集群(三主两从一VIP) | https://liucy.blog.csdn.net/article/details/131101217 |
- 部署服务、版本、端口
| 服务名称 | 版本号 | 开放端口 | 网络模式 |
|---|---|---|---|
| Prometheus | v3.7.3 | 9090 --> 30090 | NodePort |
| node_exporter | v1.10.2 | 9100 | hostNetwork: true |
| Grafana | 12.3.0 | 3000 --> 30000 | NodePort |
| Alertmanager | v0.30.0 | 9093 | ClusterIP |
| kube-state-metrics | 2.3.0 | 8080 --> 30080 | NodePort |
| cAdvisor | latest | 8080 | ClusterIP |
- 需要提前创建好部署监控的命名空间(namespace)
kubectl create namespace monitoring二、部署Prometheus
2.1 配置Prometheus配置文件 - ConfigMap
vi prometheus-config.yaml
apiVersion: v1
kind: ConfigMap
metadata:
  labels:
    app: prometheus
  name: prometheus-configmap
  namespace: monitoring
  annotations:
    argocd.argoproj.io/sync-wave: "-1"
data:
  prometheus.yml: |
    # 全局配置
    global:
      scrape_interval: 15s			# 将抓取间隔设置为每15秒一次。默认是每分钟一次。
      evaluation_interval: 15s		# 每15秒评估一次规则。默认为每1分钟一次。
      scrape_timeout: 10s			# scrape_timeout设置为全局默认值(10秒)
    # 告警信息配置
    alerting:
      alertmanagers:
        - static_configs:
            - targets: ['localhost:9093']
    # 告警规则路径
    rule_files:
       - "/etc/prometheus/rules/*_rules.yml"

    # 抓取配置
    scrape_configs:
    # 1. 监控 Prometheus 自身
    - job_name: 'prometheus'
      static_configs:
      - targets: ['localhost:9090']
2.2 配置RBAC权限认证
由于Prometheus需要访问
Kubernetes API资源,需要配置相应的RBAC权限。创建prometheus-rbac.yaml;
vi prometheus-rbac.yaml
apiVersion: v1
kind: ServiceAccount
metadata:
  name: prometheus
  namespace: monitoring
---
apiVersion: rbac.authorization.k8s.io/v1
kind: ClusterRole
metadata:
  name: prometheus
rules:
- apiGroups: [""]
  resources:
  - nodes
  - nodes/proxy
  - services
  - endpoints
  - pods
  verbs: ["get", "list", "watch"]
- apiGroups:
  - extensions
  resources:
  - ingresses
  verbs: ["get", "list", "watch"]
- apiGroups:
  - networking.k8s.io
  resources:
  - ingresses
  verbs: ["get", "list", "watch"]
- apiGroups: [""]
  resources:
  - configmaps
  verbs: ["get"]
- nonResourceURLs: ["/metrics"]
  verbs: ["get"]
---
apiVersion: rbac.authorization.k8s.io/v1
kind: ClusterRoleBinding
metadata:
  name: prometheus
roleRef:
  apiGroup: rbac.authorization.k8s.io
  kind: ClusterRole
  name: prometheus
subjects:
- kind: ServiceAccount
  name: prometheus
  namespace: monitoring
2.3 配置Prometheus部署yaml - Deployment
vi prometheus-deploy.yaml
apiVersion: apps/v1
kind: Deployment
metadata:
  name: prometheus
  namespace: monitoring
  labels:
    app: prometheus
spec:
  replicas: 1
  selector:
    matchLabels:
      app: prometheus
  template:
    metadata:
      labels:
        app: prometheus
    spec:
      serviceAccountName: prometheus
      containers:
      - name: prometheus
        image: prom/prometheus:v3.7.3
        args:
          - '--config.file=/etc/prometheus/prometheus.yml'
          - '--storage.tsdb.path=/prometheus/data/'
          - '--storage.tsdb.retention.time=15d'
          - '--storage.tsdb.retention.size=10GB'
          - '--web.console.libraries=/etc/prometheus/console_libraries'
          - '--web.console.templates=/etc/prometheus/consoles'
          - '--web.enable-lifecycle'
        ports:
        - containerPort: 9090
          name: http
        volumeMounts:
        - name: prometheus-config
          mountPath: /etc/prometheus
        - name: prometheus-storage
          mountPath: /prometheus/data
        livenessProbe:
          httpGet:
            path: /-/healthy
            port: 9090
          initialDelaySeconds: 30
          timeoutSeconds: 30
        readinessProbe:
          httpGet:
            path: /-/ready
            port: 9090
          initialDelaySeconds: 30
          timeoutSeconds: 30
      volumes:
      - name: prometheus-config
        configMap:
          name: prometheus-configmap
      - name: prometheus-storage
        emptyDir: {}
      # 如需持久化存储(生产建议),使用以下配置替换 emptyDir:{}
      # persistentVolumeClaim:
      #   claimName: prometheus-pvc
2.4 配置Prometheus对外端口 - Service
vi prometheus-svc.yaml
apiVersion: v1
kind: Service
metadata:
  name: prometheus
  namespace: monitoring
  labels:
    app: prometheus
spec:
  type: NodePort
  ports:
    - port: 9090
      targetPort: 9090
      nodePort: 30090
      protocol: TCP
      name: http
  selector:
    app: prometheus

# 如需clusterip可使用以下spec配置
#spec:
#  type: ClusterIP
#  ports:
#  - port: 9090
#    targetPort: 9090
#    protocol: TCP
#    name: http
#  selector:
#    app: prometheus
2.5 部署 Prometheus 服务
将如上四个yaml文件放到服务器上,依次创建启动
- 部署Prometheus配置文件
# 部署Prometheus配置文件
kubectl apply -f prometheus-config.yaml

# 查看Prometheus配置文件
kubectl get configmap -n monitoring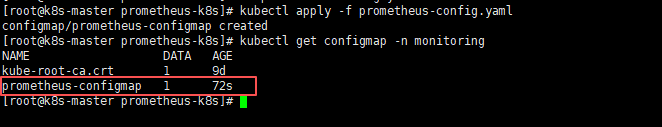
- 部署Prometheus RBAC权限认证
# 部署Prometheus RBAC权限认证
kubectl apply -f prometheus-rbac.yaml

# 查看Prometheus RBAC权限认证
kubectl get sa -n monitoring
kubectl get ClusterRole | grep prometheus
kubectl get ClusterRoleBinding | grep prometheus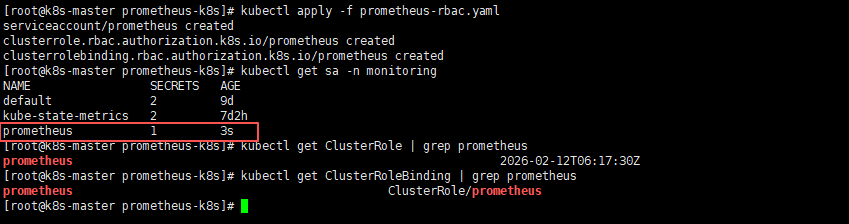
- 部署Prometheus服务
# 部署Prometheus服务
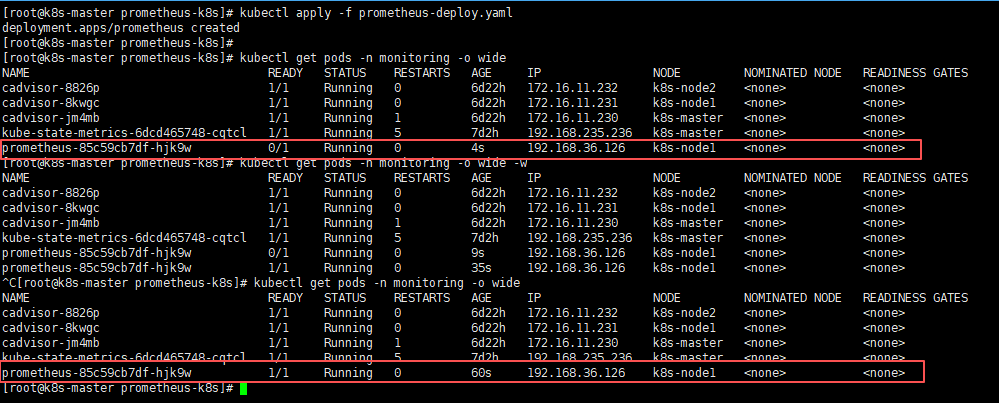
kubectl apply -f prometheus-deploy.yaml
# 查看Prometheus服务(需Prometheus pod的状态变为1/1则为正常状态)
kubectl get pods -n monitoring -o wide因为第一次需要拉取镜像所以会比较慢一些,如果不放心,或较长时间还是0/1状态,可以使用kubectl describe pods -n monitoring pod名称 此命令查看pod的状态日志;
- 部署Prometheus service,将端口暴露出来
# 部署Prometheus Service
kubectl apply -f prometheus-svc.yaml

# 查看Prometheus Service
kubectl get svc -n monitoring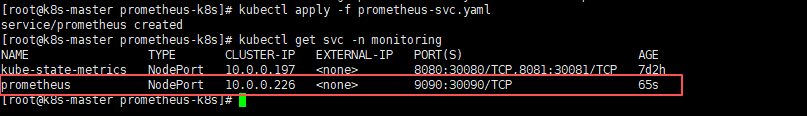
2.6 页面访问验证
页面访问Prometheus web服务:node ip:30090,node ip任意节点ip就行;
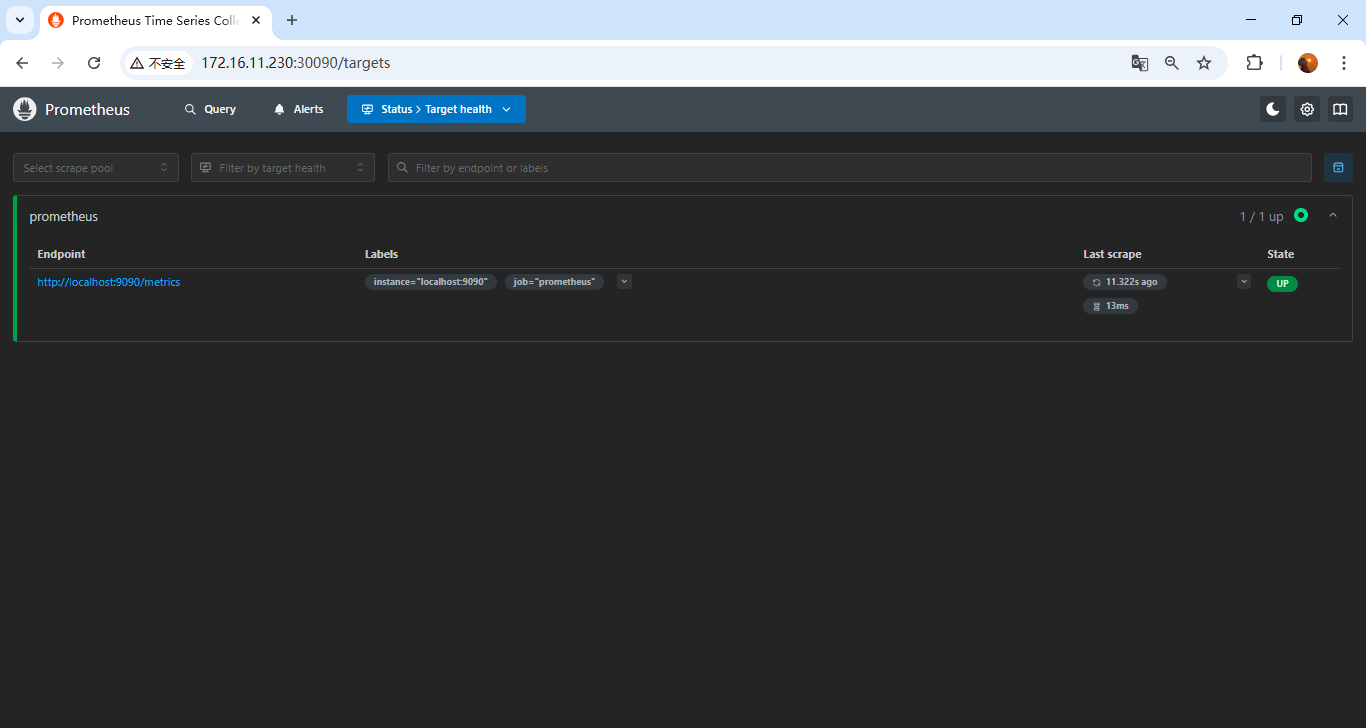
能出来页面和如图结果就没问题;
三、部署node_exporter
使用
DaemonSet方式部署node_exporter服务,因为每个节点都需要部署一个node_exporter服务,来提供数据抓取,所以可以采用Daemonset的方式部署;
3.1 配置node-exporter部署yaml - DaemonSet
vi node-export.yaml
apiVersion: apps/v1
kind: DaemonSet
metadata:
  name: node-exporter
  namespace: monitoring
  labels:
    name: node-exporter
spec:
  selector:
    matchLabels:
     name: node-exporter
  template:
    metadata:
      labels:
        name: node-exporter
    spec:
      hostPID: true
      hostIPC: true
      hostNetwork: true
      tolerations: 	# 添加容忍
        - key: node-role.kubernetes.io/master
          effect: NoSchedule
          operator: Exists
        - key: node-role.kubernetes.io/control-plane
          effect: NoSchedule
          operator: Exists
      containers:
      - name: node-exporter
        image: prom/node-exporter:v1.10.2
        imagePullPolicy: IfNotPresent
        ports:
        - containerPort: 9100
          name: http
          protocol: TCP
        securityContext:
          privileged: true
          runAsUser: 0
        args:
          - --collector.systemd
          - --collector.tcpstat
          - --collector.pressure
          - --collector.hwmon
          - --collector.mountstats
          - --collector.ntp
          - --path.procfs=/host/proc
          - --path.sysfs=/host/sys
          - --path.rootfs=/host/root
          - --collector.filesystem.mount-points-exclude=^/(sys|proc|dev|host|etc)($$|/)
          - --collector.filesystem.fs-types-exclude=^(sys|proc|auto|cgroup|devpts|ns|au|fuse\.lxc|mqueue)(fs|)$
        volumeMounts:
        - name: proc
          mountPath: /host/proc
          readOnly: true
        - name: sys
          mountPath: /host/sys
          readOnly: true
        - name: root
          mountPath: /host/root
          readOnly: true
        - name: systemd-private
          mountPath: /run/systemd/private
          readOnly: true
        resources:
          limits:
            cpu: 250m
            memory: 180Mi
          requests:
            cpu: 102m
            memory: 180Mi
      volumes:
      - name: proc
        hostPath:
          path: /proc
      - name: sys
        hostPath:
          path: /sys
      - name: root
        hostPath:
          path: /
      - name: systemd-private
        hostPath:
          path: /run/systemd/private
          type: Socket
3.2 部署node-exporter服务
kubectl apply -f node-export.yaml3.3 验证node-exporter服务
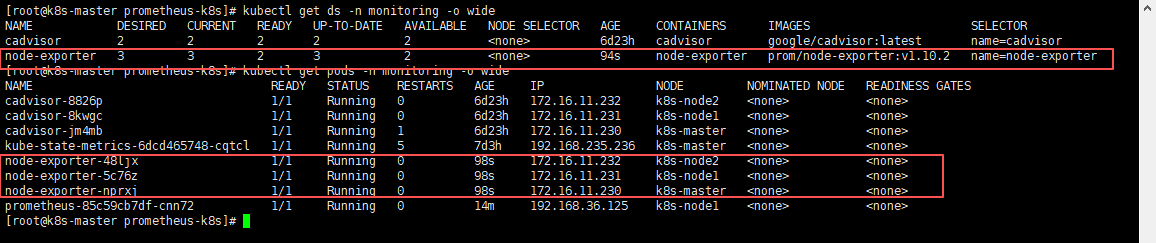
# 查看daemonset是否正确
kubectl get ds -n monitoring -o wide

# 查看pod是否所有节点都部署了一个
kubectl get pods -n monitoring -o wide可以通过NODE看到,每个节点都部署了一套node-exporter服务;
3.4 添加node-exporter到Prometheus配置中抓取数据
再Prometheus的configmap中追加此配置到scrape_configs中;
    - job_name: 'node-exporter'
      kubernetes_sd_configs:
      - role: node              # ← 自动发现所有节点
      relabel_configs:
      - source_labels: [__address__]
        regex: '(.*):10250'     # Kubelet 端口
        replacement: '${1}:9100' # ← 改成 node-exporter 端口
        target_label: __address__
        action: replace
      - action: labelmap
        regex: __meta_kubernetes_node_label_(.+)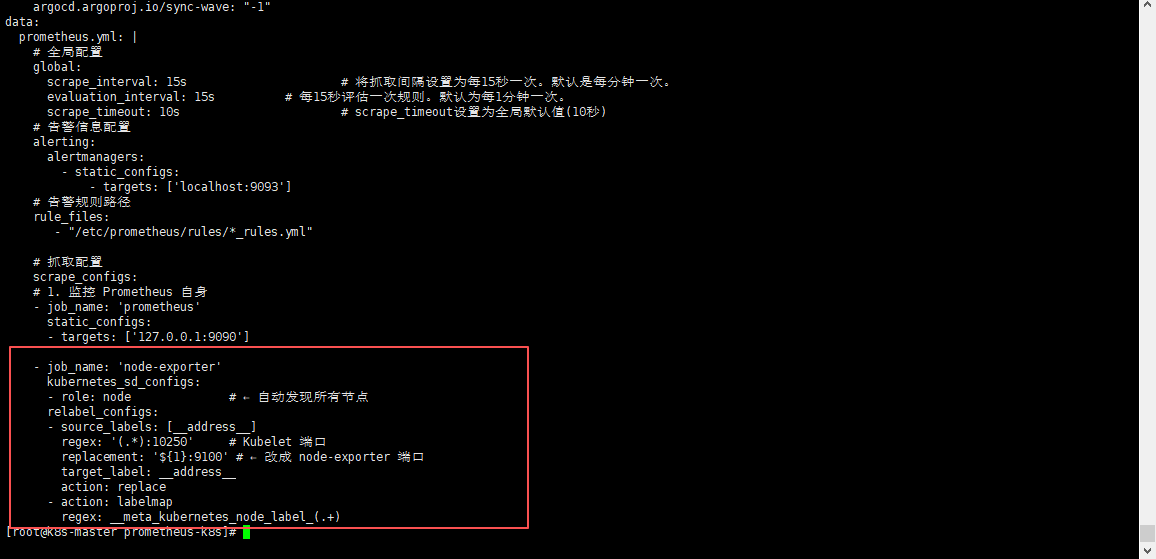
3.5 更新prometheus配置文件并热重载
- 更新Prometheus配置文件
kubectl apply -f prometheus-config.yaml需等待一会,进行配置同步,可以使用
kubectl exec -it -n monitoring pod名称 -- sh进入查看Prometheus配置文件,进行确认是否同步成功;
- 热重载Prometheus配置文件,使其生效
curl -X POST localhost:30090/-/reload3.6 页面验证
访问:
node ip:30090/targets
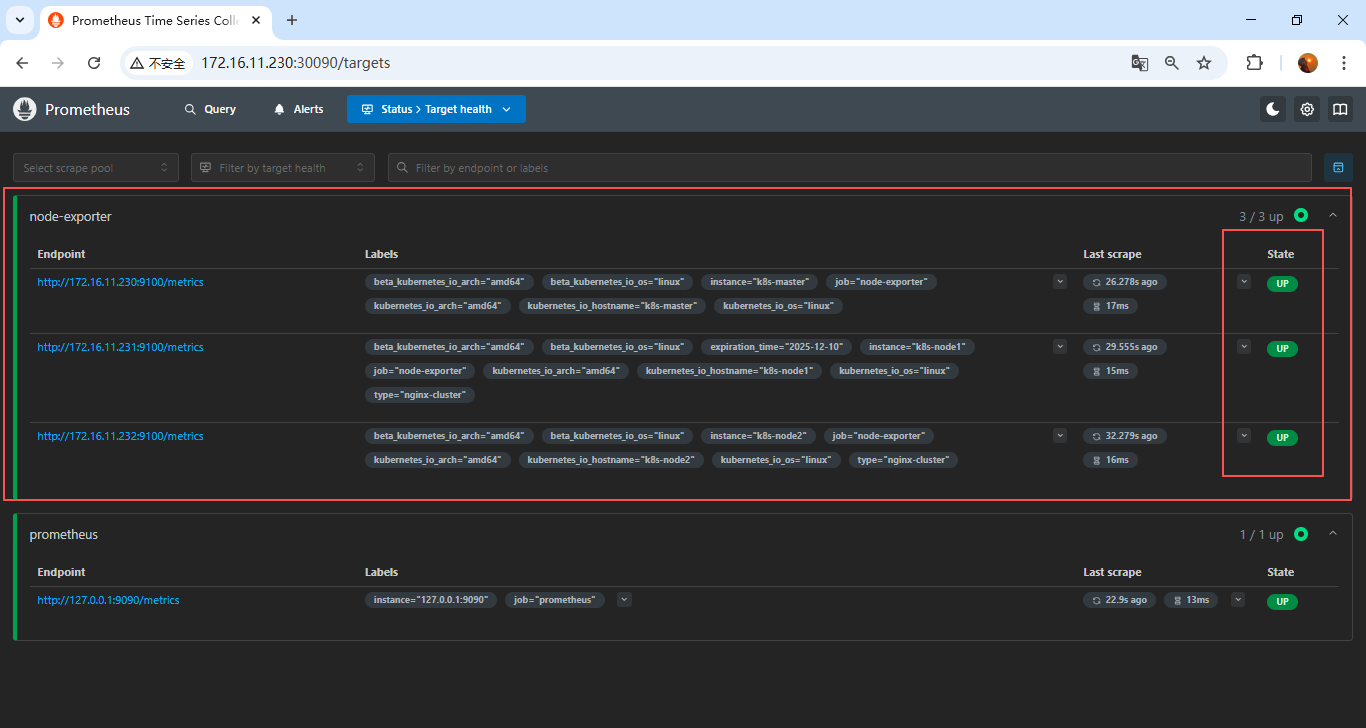
可以发现三台node_exporter已经加上了,也支持nodePromQL查询了;
四、部署Grafana
4.1 配置Grafana配置文件 - ConfigMap
vi grafana-config.yaml
apiVersion: v1
kind: ConfigMap
metadata:
  name: grafana-configmap
  namespace: monitoring
data:
  grafana.ini: |
    # 应用模式
    app_mode = production

    # 数据存储路径及时间配置
    [paths]
    # 明确指定数据路径(虽然默认就是 /var/lib/grafana,但建议显式配置)
    data = /var/lib/grafana
    # 超过给定持续时间的临时文件将被删除
    temp_data_lifetime = 24h
    logs = /var/lib/grafana/logs
    plugins = /var/lib/grafana/plugins
    provisioning = /etc/grafana/provisioning

    # 服务器基础配置
    [server]
    protocol = http
    http_port = 3000
    domain = localhost
    enforce_domain = false
    root_url = %(protocol)s://%(domain)s:%(http_port)s/
    serve_from_sub_path = false
    router_logging = false
    static_root_path = public
    enable_gzip = false

    # 数据库配置:生产可切换为”mysql”、"postgres”、“sqlite3”等
    [database]
    type = sqlite3
    host = 127.0.0.1:3306
    name = grafana
    user = root
    # 如果密码包含 # 或 ;,您必须用三引号包裹。例如 """#password;"""
    password =
    # 使用 URL 或前面的字段来配置数据库
    # 示例:mysql://user:secret@host:port/database
    url =
    # 仅在运行单个 Grafana 实例时设置为 false。
    high_availability = true
    # 最大空闲连接设置,默认为 2
    max_idle_conn = 2
    # 最大连接设置,默认为 0(表示未设置)
    max_open_conn =
    # 连接最大生命周期默认为 14400(表示 14400 秒或 4 小时)
    conn_max_lifetime = 14400
    # 设置为 true 以记录 SQL 调用和执行时间。
    log_queries =
    # 对于 "postgres",使用 "disable"、"require" 或 "verify-full"
    # 对于 "mysql",使用 "true"、"false" 或 "skip-verify"。
    ssl_mode = disable
    # 对于 "postgres",使用 "1" 启用或 "0" 禁用 SNI
    ssl_sni =
    # 仅适用于 "sqlite3",相对于 data_path 设置的路径
    path = /var/lib/grafana/grafana.db

    # 安全配置
    [security]
    # 禁用首次启动 Grafana 时创建管理员用户
    disable_initial_admin_creation = false
    # 默认管理员用户,在启动时创建
    admin_user = admin
    # 默认管理员密码,可以在首次启动 Grafana 之前更改,或在个人资料设置中更改(生产不建议使用)
    admin_password = admin123
    # 默认管理员邮箱,在启动时创建
    admin_email = admin@localhost
    # 用于签名
    secret_key = SW2YcwTIb9zpOOhoPsMm
    # 当前用于信封加密的密钥提供程序,默认为 secret_key 指定的静态值
    encryption_provider = secretKey.v1
    # 禁用对暴力登录尝试的保护
    disable_brute_force_login_protection = false
    # 用户被锁定之前的最大失败登录尝试次数
    brute_force_login_protection_max_attempts = 5
    # 禁用按用户名对暴力登录尝试的保护
    disable_username_login_protection = false
    # 禁用按 IP 地址对暴力登录尝试的保护
    disable_ip_address_login_protection = true

    [auth.basic]
    enabled = true
    password_policy = false

    # 禁用匿名访问(安全)
    [auth.anonymous]
    enabled = false

    # 是否打开默认数据面板
    [public_dashboards]
    enabled = true

    [dashboards]
    versions_to_keep = 20
    min_refresh_interval = 5s

    [log]
    mode = console
    level = info

    # 健康检查和指标
    [metrics]
    enabled = true
4.2 配置Grafana持久化 - PV/PVC
这里测试,单节点直接存到指定路径下了,如果是生产,推荐使用
NFS;
vi grafana-pvc.yaml
apiVersion: v1
kind: PersistentVolume
metadata:
  name: grafana-pv
spec:
  capacity:
    storage: 20Gi
  accessModes:
    - ReadWriteOnce
  hostPath:
    path: /data/grafana-data  # 宿主机目录
  persistentVolumeReclaimPolicy: Retain
---
apiVersion: v1
kind: PersistentVolumeClaim
metadata:
  name: grafana-pvc
  namespace: monitoring
spec:
  accessModes:
    - ReadWriteOnce
  resources:
    requests:
      storage: 20Gi  # 根据需求调整
  volumeName: grafana-pv  # ← 直接绑定到上面创建的 PV
4.3 配置Grafana部署yaml - Deployment
vi grafana-deploy.yaml
apiVersion: apps/v1
kind: Deployment
metadata:
  name: grafana
  namespace: monitoring
  labels:
    app: grafana
spec:
  replicas: 1
  selector:
    matchLabels:
      app: grafana
  template:
    metadata:
      labels:
        app: grafana
    spec:
      # 指定部署节点,避免重启pod到其他节点上,持久化数据丢失
      nodeName: k8s-node1
      initContainers:
        - name: fix-permissions
          image: busybox:1.36
          command: ["sh", "-c", "chown -R 472:472 /var/lib/grafana"]
          volumeMounts:
            - name: grafana-data
              mountPath: /var/lib/grafana
          securityContext:
            runAsUser: 0
      containers:
      - name: grafana
        image: grafana/grafana:12.3.0
        ports:
        - containerPort: 3000
          name: http
        volumeMounts:
        - name: grafana-config
          mountPath: /etc/grafana/grafana.ini
          subPath: grafana.ini
        - name: grafana-data
          mountPath: /var/lib/grafana  # Grafana 默认数据目录
        resources:
          requests:
            cpu: 100m
            memory: 256Mi
          limits:
            cpu: 500m
            memory: 512Mi
        livenessProbe:
          httpGet:
            path: /api/health
            port: 3000
          initialDelaySeconds: 30
          timeoutSeconds: 10
        readinessProbe:
          httpGet:
            path: /api/health
            port: 3000
          initialDelaySeconds: 10
          timeoutSeconds: 5
      volumes:
      - name: grafana-config
        configMap:
          name: grafana-configmap
      - name: grafana-data
        persistentVolumeClaim:
          claimName: grafana-pvc  # 使用 PVC
4.4 配置Grafana对外端口 - Service
vi grafana-svc.yaml
apiVersion: v1
kind: Service
metadata:
  name: grafana
  namespace: monitoring
spec:
  type: NodePort
  ports:
  - port: 3000
    targetPort: 3000
    nodePort: 30000
    protocol: TCP
    name: http
  selector:
    app: grafana
4.5 部署 Grafana 服务
将如上四yaml文件放到服务器上,依次创建启动
- 部署Grafana配置文件
# 部署Grafana配置文件
kubectl apply -f grafana-config.yaml

# 查看Grafana配置文件
kubectl get configmap -n monitoring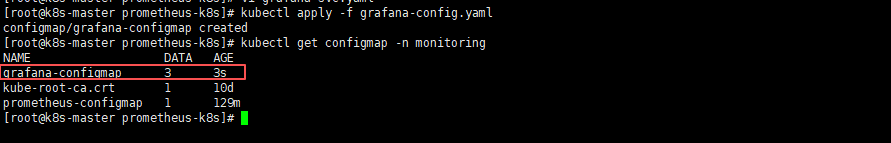
- 部署Grafana持久化PV/PVC
# 部署Grafana持久化PV/PVC
kubectl apply -f grafana-pvc.yaml

# 查看Grafana持久化PV/PVC
kubectl get pv -n monitoring
kubectl get pvc -n monitoring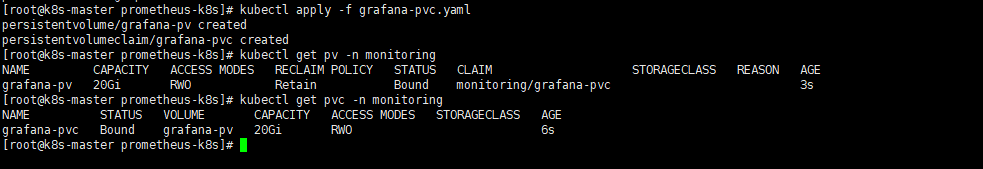
可以看到PV和PVC的状态都已经是Bound(已绑定)的状态了,所以创建pv和pvc就没问题,但还需要注意是否绑定上deployment,那么就需要部署deployment之后才能验证;
- 部署Grafana服务
# 部署Grafana服务
kubectl apply -f grafana-deploy.yaml

# 查看Grafana服务(需Grafana pod的状态变为1/1则为正常状态)
kubectl get pods -n monitoring -o wide因为第一次需要拉取镜像所以会比较慢一些,如果不放心,或较长时间还是0/1状态,可以使用kubectl describe pods -n monitoring pod名称 此命令查看pod的状态日志;
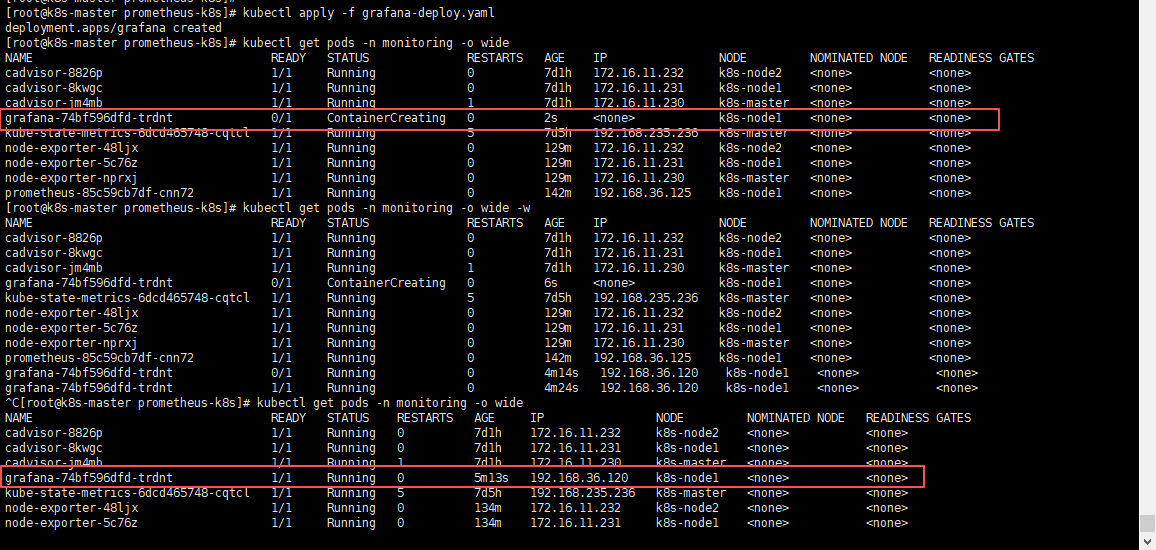
pod创建正常之后,我们可以看到grafana运行在了k8s-node1节点,那么可以登录k8s-node1服务器,去挂载的目录看一下,是否存在数据;
# k8s-node1节点

cd /data/
cd grafana-data/
ls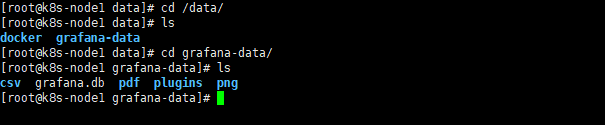
可以看到数据已经存储到宿主机了,那就没问题;
- 部署Grafana service,将端口暴露出来
# 部署Grafana Service
kubectl apply -f grafana-svc.yaml

# 查看Grafana Service
kubectl get svc -n monitoring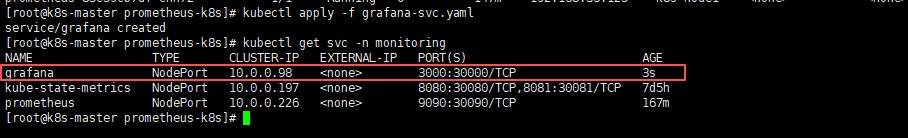
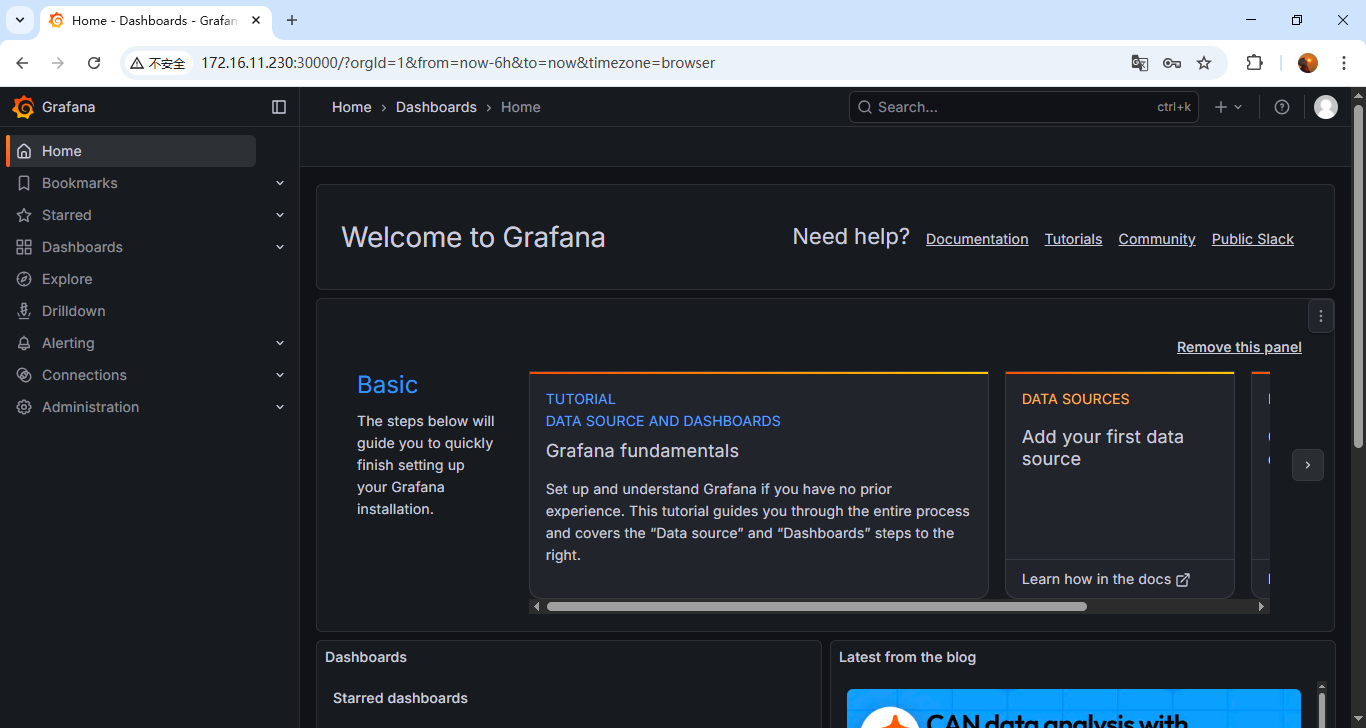
4.6 页面访问验证
页面访问Grafana web服务:node ip:30000,node ip任意节点ip就行;
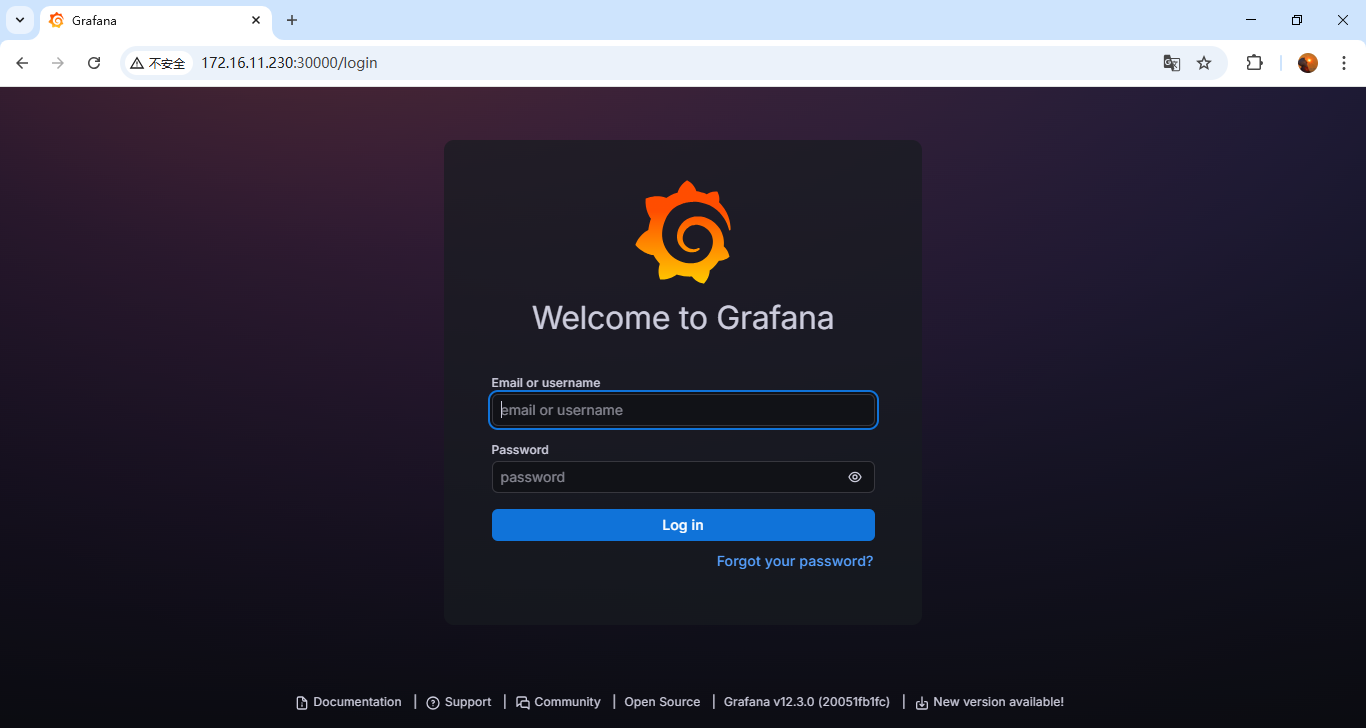
输入用户名密码登录进来页面没问题就行;
注意(验证持久化):可以修改个中文或者其他之后删除pod,再启动一个新的pod,看看数据是否存在,持久化是否生效;
- Grafana的使用请参考:【Linux】Prometheus + Grafana的使用
- Grafana页面修改中文请参考:【Linux】Prometheus + Grafana 的部署及介绍(亲测无问题)
第6.2.4步;
五、部署Alertmanager告警
5.1 配置Alertmanager配置文件 - ConfigMap
vi alertmanager-config.yaml
请注意需要修改配置中的收件人及发件人的信息;
apiVersion: v1
kind: ConfigMap
metadata:
  name: alertmanager-configmap
  namespace: monitoring
data:
  alertmanager.yml: |
    global:
      # 全局配置
      resolve_timeout: 5m  # 解析的超时时间
      smtp_smarthost: 'smtp.163.com:465'      # 邮件服务器
      smtp_from: 'alert@example.com'          # 发件人
      smtp_auth_username: 'your-email@qq.com' # 登录用户
      smtp_auth_password: 'your-auth-code'    # 授权码,不是密码!
      smtp_require_tls: false

    route:    # 将告警具体怎么发送
      group_by: ['alertname']  # 根据标签进行分组
      group_wait: 10s          # 发送告警等待时间
      group_interval: 10s      # 发送告警邮件的间隔时间
      repeat_interval: 1h      # 重复的告警发送时间
      receiver: 'email'        # 接收者是谁,需和receivers中的name一致
    receivers:                 # 将告警发送给谁
    - name: 'email'
      email_configs:
      # 接收者
      - to: 'user1@qq.com,user2@qq.com'
        send_resolved: true    # 开启恢复通知
        # 告警标题
        headers:
          Subject: >
            {{ if eq .Status "firing" }}🔥【Prometheus告警】服务器:  {{ .CommonLabels.instance  }} 发生 {{ .CommonLabels.alertname }} 故障
            {{ else }}✅【Prometheus恢复】服务器: {{ .CommonLabels.instance }} 发生 {{ .CommonLabels.alertname }} 已恢复
            {{ end }}
        # 引入告警模板
        html: '{{ template "email.html" . }}'
    # 告警模板存放地址
    templates:
      - '/etc/alertmanager/templates/email.tmpl'
    inhibit_rules:   # 抑制告警
      - source_match:
          severity: 'critical'   # 当收到同一台机器发送的critical时候,屏蔽掉warning类型的告警
        target_match:
          severity: 'warning'
        equal: ['alertname', 'severity', 'instance']  # 根据这些标签来定义抑制
vi alertmanager-templates-config.yaml
apiVersion: v1
kind: ConfigMap
metadata:
  name: alertmanager-templates-configmap
  namespace: monitoring
data:
  email.tmpl: |
    {{ define "email.html" }}
    <!DOCTYPE html>
    <html>
    <head>
        <meta http-equiv="Content-Type" content="text/html; charset=utf-8">
        <style type="text/css">
            body {
                font-family: 'Helvetica Neue', Arial, sans-serif;
                line-height: 1.6;
                color: #333;
                max-width: 700px;
                margin: 0 auto;
                padding: 20px;
                background-color: #f9f9f9;
            }
            .alert-card {
                border-radius: 8px;
                padding: 20px;
                margin-bottom: 20px;
                box-shadow: 0 2px 10px rgba(0,0,0,0.1);
            }
            .alert-critical {
                background: linear-gradient(135deg, #FFF6F6 0%, #FFEBEB 100%);
                border-left: 5px solid #FF5252;
            }
            .alert-resolved {
                background: linear-gradient(135deg, #F6FFF6 0%, #EBFFEB 100%);
                border-left: 5px solid #4CAF50;
            }
            .alert-title {
                font-size: 18px;
                font-weight: bold;
                margin-bottom: 15px;
                display: flex;
                align-items: center;
            }
            .alert-icon {
                width: 24px;
                height: 24px;
                margin-right: 10px;
            }
            .alert-field {
                margin-bottom: 8px;
                display: flex;
            }
            .field-label {
                font-weight: bold;
                min-width: 80px;
                color: #555;
            }
            .field-value {
                flex: 1;
            }
            .timestamp {
                color: #666;
                font-size: 13px;
                margin-top: 15px;
                text-align: right;
            }
            .divider {
                height: 1px;
                background: #eee;
                margin: 15px 0;
            }
        </style>
    </head>
    <body>
    {{- if gt (len .Alerts.Firing) 0 -}}
        <div class="alert-header alert-critical">

        </div>
        {{- range $index, $alert := .Alerts -}}
            <div class="alert-card alert-critical">
                <div class="alert-title">
                    告警触发 - 请立即处理!
                </div>
                <div class="alert-field">
                    <span class="field-label">告警名称:</span>
                    <span class="field-value">{{ .Labels.alertname }}</span>
                </div>
                <div class="alert-field">
                    <span class="field-label">告警级别:</span>
                    <span class="field-value">{{ .Labels.severity }}</span>
                </div>
                <div class="alert-field">
                    <span class="field-label">告警主机:</span>
                    <span class="field-value">{{ .Labels.instance }}</span>
                </div>
                <div class="alert-field">
                    <span class="field-label">告警摘要:</span>
                    <span class="field-value">{{ .Annotations.summary }}</span>
                </div>
                <div class="alert-field">
                    <span class="field-label">告警时间:</span>
                    <span class="field-value">{{ (.StartsAt.Add 28800e9).Format "2006-01-02 15:04:05" }}</span>
                </div>
                {{- if .Annotations.description }}
                <div class="divider"></div>
                <div class="alert-field">
                    <span class="field-label">告警详情:</span>
                    <span class="field-value">{{ .Annotations.description }}</span>
                </div>
                {{- end }}
            </div>
        {{- end }}
    {{- end }}

    {{- if gt (len .Alerts.Resolved) 0 -}}
        {{- range $index, $alert := .Alerts -}}
        <div class="alert-card alert-resolved">
            <div class="alert-title">
                告警恢复通知
            </div>
            <div class="alert-field">
                <span class="field-label">告警名称:</span>
                <span class="field-value">{{ .Labels.alertname }}</span>
            </div>
            <div class="alert-field">
                <span class="field-label">告警主机:</span>
                <span class="field-value">{{ .Labels.instance }}</span>
            </div>
            <div class="alert-field">
                <span class="field-label">告警摘要:</span>
                <span class="field-value">[ {{ .Annotations.summary }}] 此告警已经恢复~</span>
            </div>
            <div class="alert-field">
                <span class="field-label">告警时间:</span>
                <span class="field-value">{{ (.StartsAt.Add 28800e9).Format "2006-01-02 15:04:05" }}</span>
            </div>
            <div class="alert-field">
                <span class="field-label">恢复时间:</span>
                <span class="field-value">{{ (.EndsAt.Add 28800e9).Format "2006-01-02 15:04:05" }}</span>
            </div>
            {{- if .Annotations.description }}
            <div class="alert-field">
                <span class="field-label">告警详情:</span>
                <span class="field-value">{{ .Annotations.description }}</span>
            </div>
            {{- end }}
        </div>
        {{- end }}
    {{- end }}

    </body>
    </html>
    {{ end }}
5.2 配置Alertmanager部署yaml - Deployment
vi alertmanager-deploy.yaml
apiVersion: apps/v1
kind: Deployment
metadata:
  name: alertmanager
  namespace: monitoring
  labels:
    app: alertmanager
spec:
  replicas: 1              # 生产建议 3 个副本做高可用
  selector:
    matchLabels:
      app: alertmanager
  template:
    metadata:
      labels:
        app: alertmanager
    spec:
      containers:
      - name: alertmanager
        image: prom/alertmanager:v0.30.0
        args:
          - '--config.file=/etc/alertmanager/alertmanager.yml'
          - '--storage.path=/alertmanager'           # 告警状态存储
          - '--web.listen-address=:9093'
          - '--web.external-url=http://alertmanager:9093'
          - '--cluster.listen-address=0.0.0.0:9094'   # 集群通信端口(HA用)
          - '--log.level=info'
        ports:
        - containerPort: 9093
          name: http
        - containerPort: 9094
          name: cluster
        volumeMounts:
        - name: alertmanager-config
          mountPath: /etc/alertmanager/alertmanager.yml
          subPath: alertmanager.yml
        - name: alertmanager-templates
          mountPath: /etc/alertmanager/templates/email.tmpl
          subPath: email.tmpl
        resources:
          requests:
            cpu: 100m
            memory: 256Mi
          limits:
            cpu: 500m
            memory: 512Mi
        livenessProbe:
          httpGet:
            path: /-/healthy
            port: 9093
          initialDelaySeconds: 30
          timeoutSeconds: 10
        readinessProbe:
          httpGet:
            path: /-/ready
            port: 9093
          initialDelaySeconds: 10
          timeoutSeconds: 5
      volumes:
      - name: alertmanager-config
        configMap:
          name: alertmanager-configmap
      - name: alertmanager-templates
        configMap:
          name: alertmanager-templates-configmap
5.3 配置Alertmanager对内端口 - Service
vi alertmanager-svc.yaml
apiVersion: v1
kind: Service
metadata:
  name: alertmanager
  namespace: monitoring
  labels:
    app: alertmanager
spec:
  type: ClusterIP
  ports:
  - port: 9093
    targetPort: 9093
    name: http
  - port: 9094
    targetPort: 9094
    name: cluster
  selector:
    app: alertmanager
5.4 部署 Alertmanager 服务
将如上四个yaml文件放到服务器上,依次创建启动
- 部署Alertmanager配置文件
# 部署Alertmanager配置文件
kubectl apply -f alertmanager-config.yaml
kubectl apply -f alertmanager-templates-config.yaml

# 查看Alertmanager配置文件
kubectl get configmap -n monitoring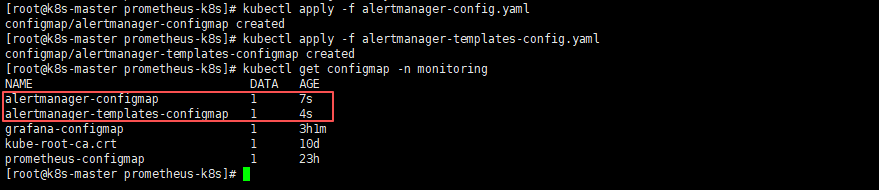
- 部署Alertmanager服务
# 部署Alertmanager服务
kubectl apply -f alertmanager-deploy.yaml

# 查看Alertmanager服务(需alertmanager pod的状态变为1/1则为正常状态)
kubectl get pods -n monitoring -o wide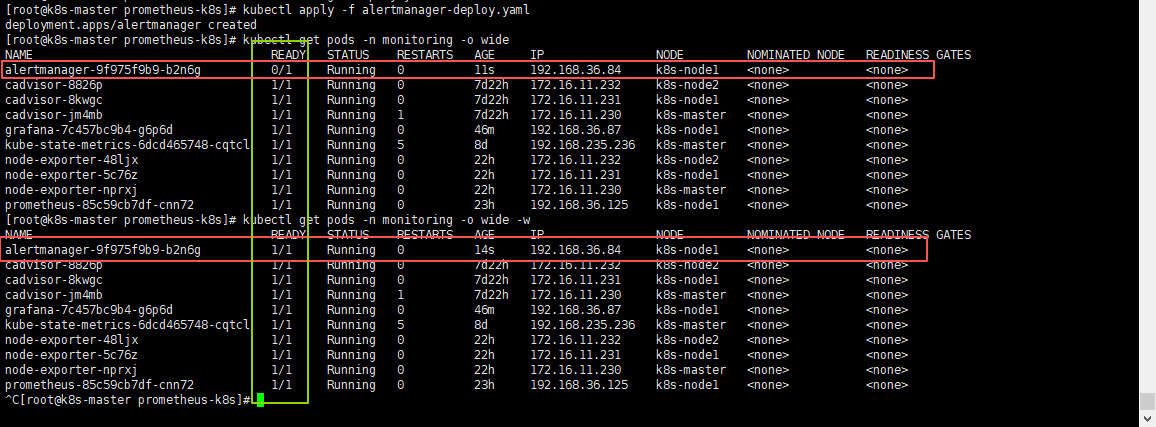
- 部署Alertmanager service,不需要暴露端口,集群内使用就行,所以采用
ClusterIP方式
# 部署Alertmanager Service
kubectl apply -f alertmanager-svc.yaml

# 查看Alertmanager Service
kubectl get svc -n monitoring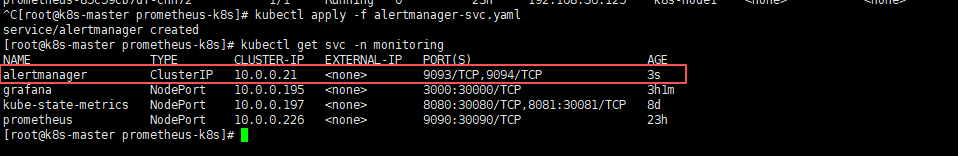
5.5 配置Prometheus配置文件,添加Alertmanager告警配置
直接修改Prometheus的配置文件:
prometheus-config.yaml,添加Alertmanager、Grafana抓取配置及Alertmanager的告警配置;
注意:我这里使用的域名,域名需要提前部署
CoreDNS服务,如果需要部署CoreDNs可参考:K8S 部署 CoreDNS 之 DNS 域名获取,部署好之后你也可以使用域名了;
如果没有部署CoreDNS服务的话,alertmanager的配置可以使用ClusterIP:9093,grafana的配置可以使用ClusterIP:3000或节点IP:30000;ClusterIP查看方式:kubectl get svc -n monitoring,找到对应的svc name及ClusterIP即可;
    # 告警信息配置
    alerting:
      alertmanagers:
        - static_configs:
            - targets: ['alertmanager.monitoring.svc.cluster.local:9093']


    # 抓取配置
    - job_name: 'grafana'
      static_configs:
      - targets: ['grafana.monitoring.svc.cluster.local:3000']

    - job_name: 'alertmanager'
      static_configs:
      - targets: ['alertmanager.monitoring.svc.cluster.local:9093']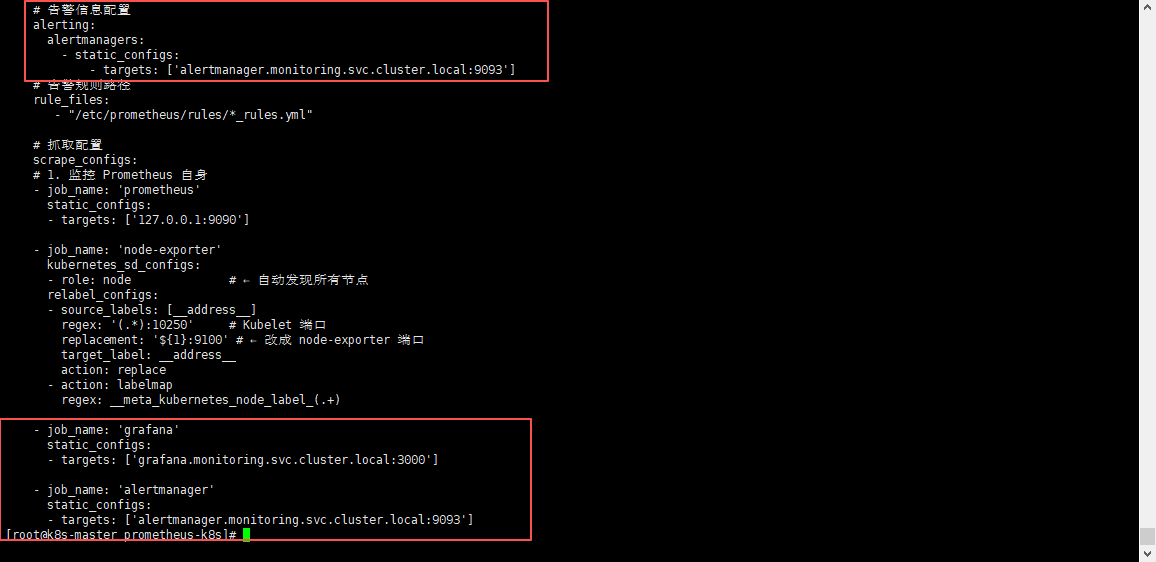
5.6 更新prometheus配置文件并热重载
- 更新Prometheus配置文件
kubectl apply -f prometheus-config.yaml需等待一会,进行配置同步,可以使用
kubectl exec -it -n monitoring pod名称 -- sh进入查看Prometheus配置文件,进行确认是否同步成功;
- 热重载Prometheus配置文件,使其生效
curl -X POST localhost:30090/-/reload5.7 页面验证
访问:
node ip:30090/targets
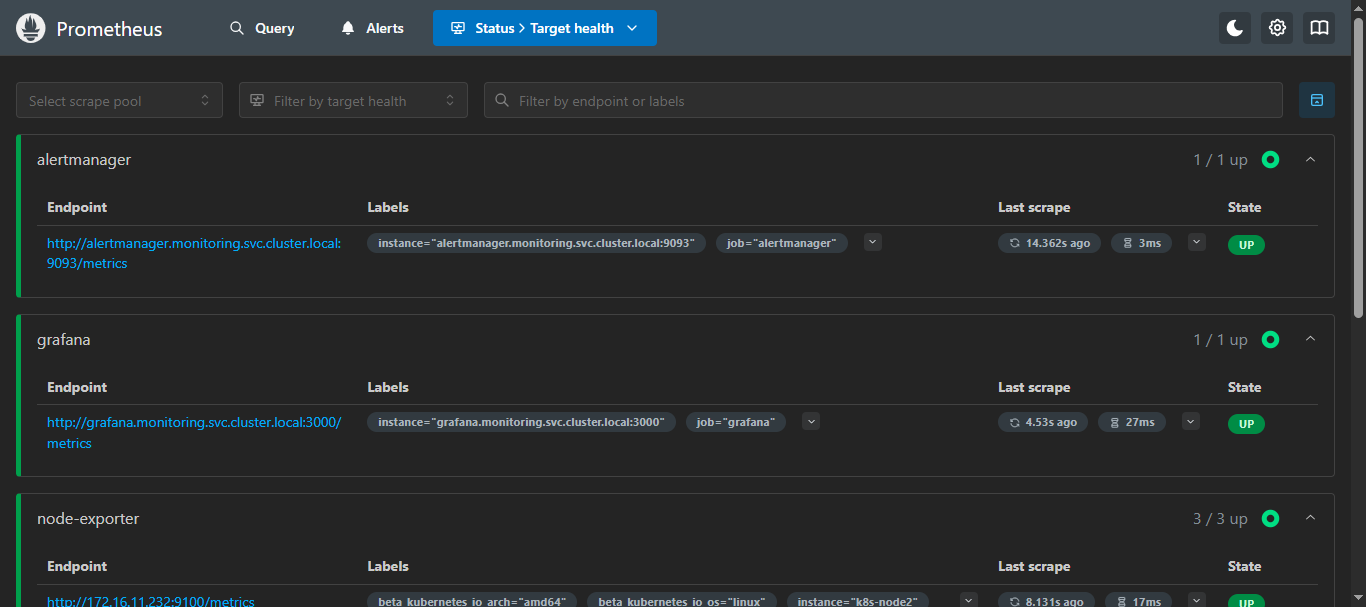
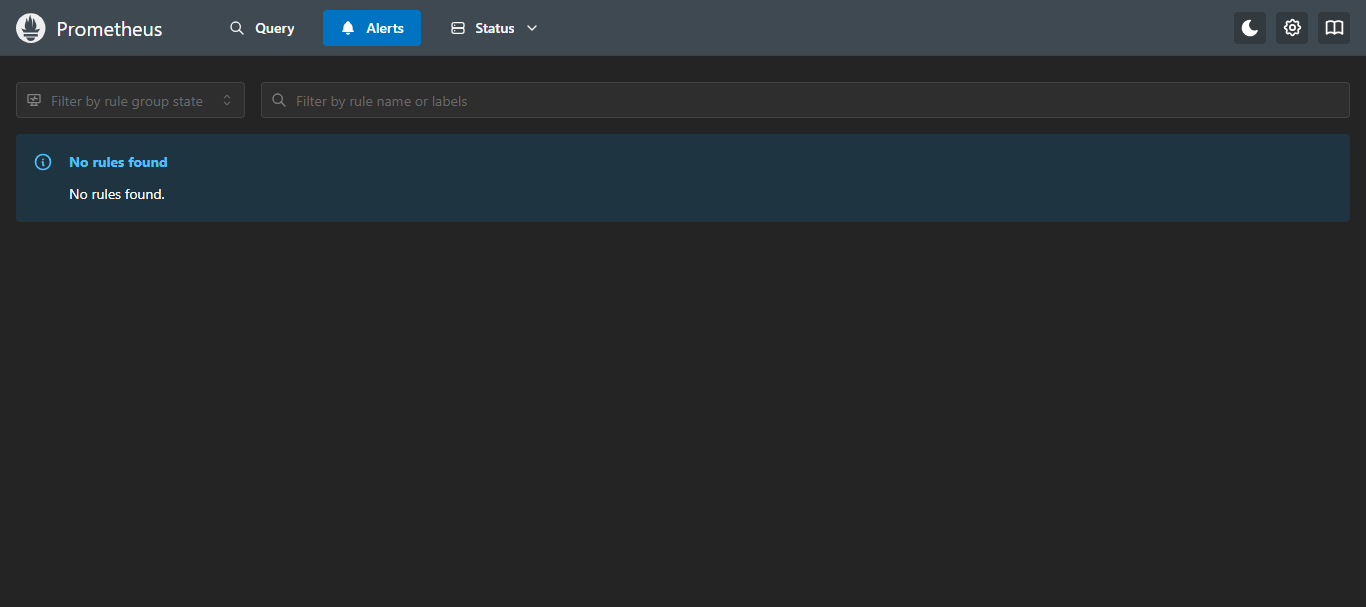
就可以看到添加的Alertmanager和Grafana的抓取指标了,那么Alerts还是没有的,因为还没有配置告警规则,所以,里面内容会展示 “未找到规则” ;
六、部署 kube-state-metrics + CAdvisor 监控k8s集群指标
6.1 k8s部署kube-state-metrics + CAdvisor
部署可参考:K8S部署kube-state-metrics + CAdvisor 并使用 Prometheus 监控 Kubernetes 指标
这里我因为最开始使用的宿主机部署的Prometheus,所以用的nodeport的模式,这里可以切换为cluster,都可以;
6.2 Prometheus 添加 K8s 集群监控目标配置
添加
kube-state-metrics和cadvisor到Prometheus配置中;
kube-state-metrics是采用的nodeport吧端口对外暴露了30080,所以直接写集群任意IP:30080即可;cadvisor采用的是network=host模式,直接写集群每台节点的ip:8088即可;
加clusterip是因为适配k8s部署的Prometheus,可直接使用域名;
    - job_name: 'kube-state-metrics'
      static_configs:
        - targets: ['kube-state-metrics.monitoring.svc.cluster.local:8080']

    - job_name: 'cadvisor'
      static_configs:
        - targets: ['cadvisor.monitoring.svc.cluster.local:8080']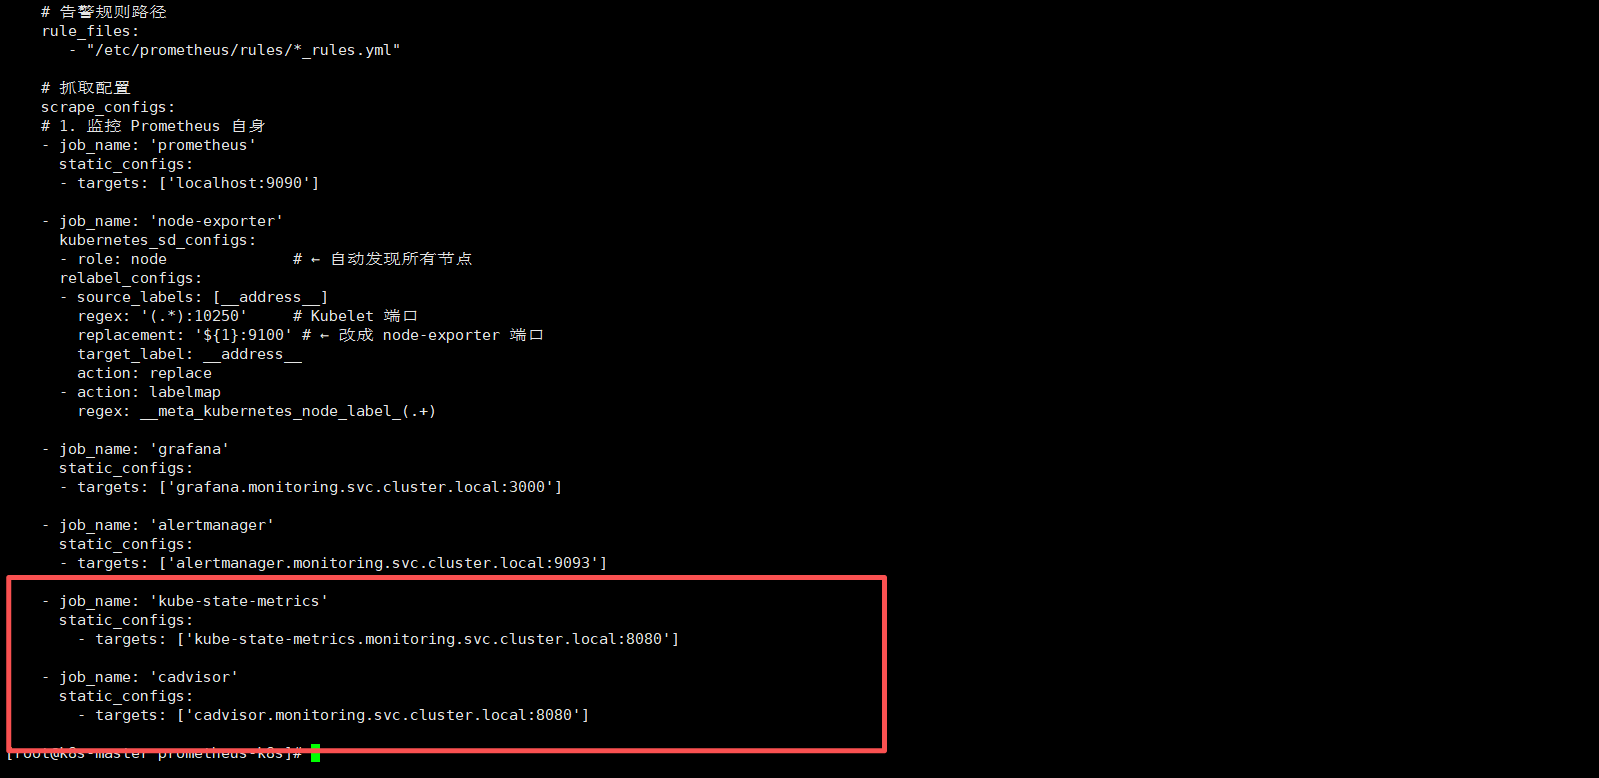
6.3 更新并重载 Prometheus 配置
- 更新Prometheus配置
kubectl apply -f prometheus-config.yaml需等待一会,进行配置同步,可以使用
kubectl exec -it -n monitoring pod名称 -- sh进入查看Prometheus配置文件,进行确认是否同步成功;
- 重载Prometheus配置
localhost可换为IP;
curl -X POST http://localhost:30090/-/reload6.4 Prometheus 页面查看
node ip:30090/targets
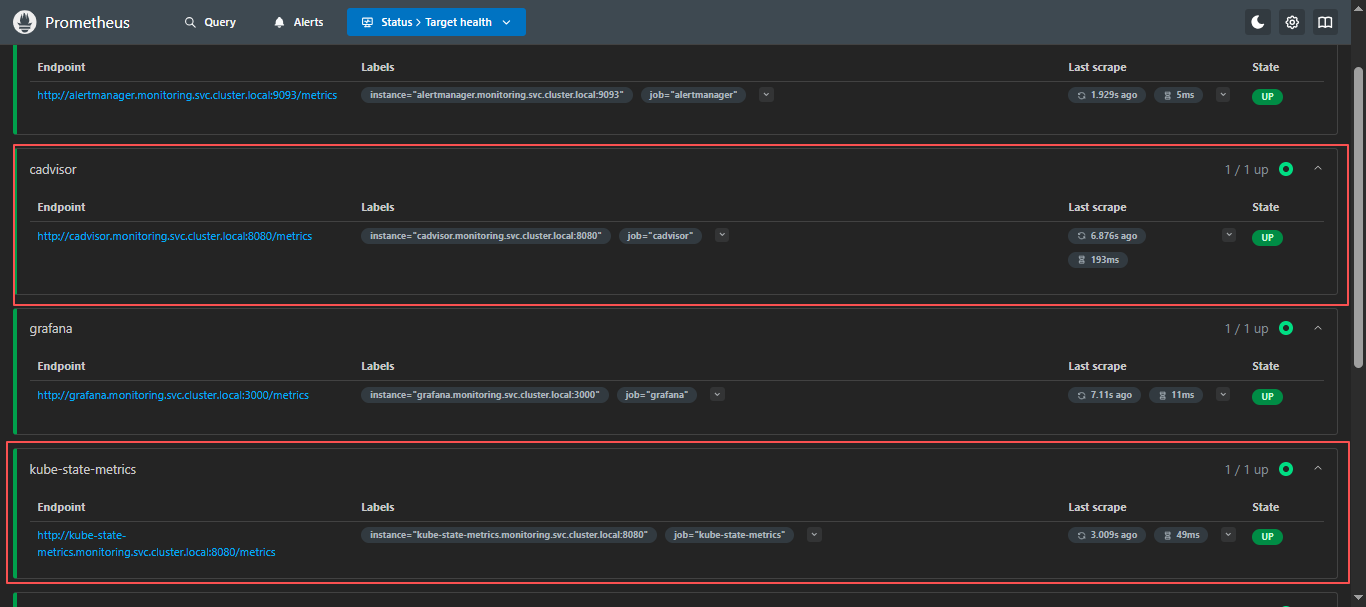
添加完成,检查PromQL是否支持查询k8s信息;
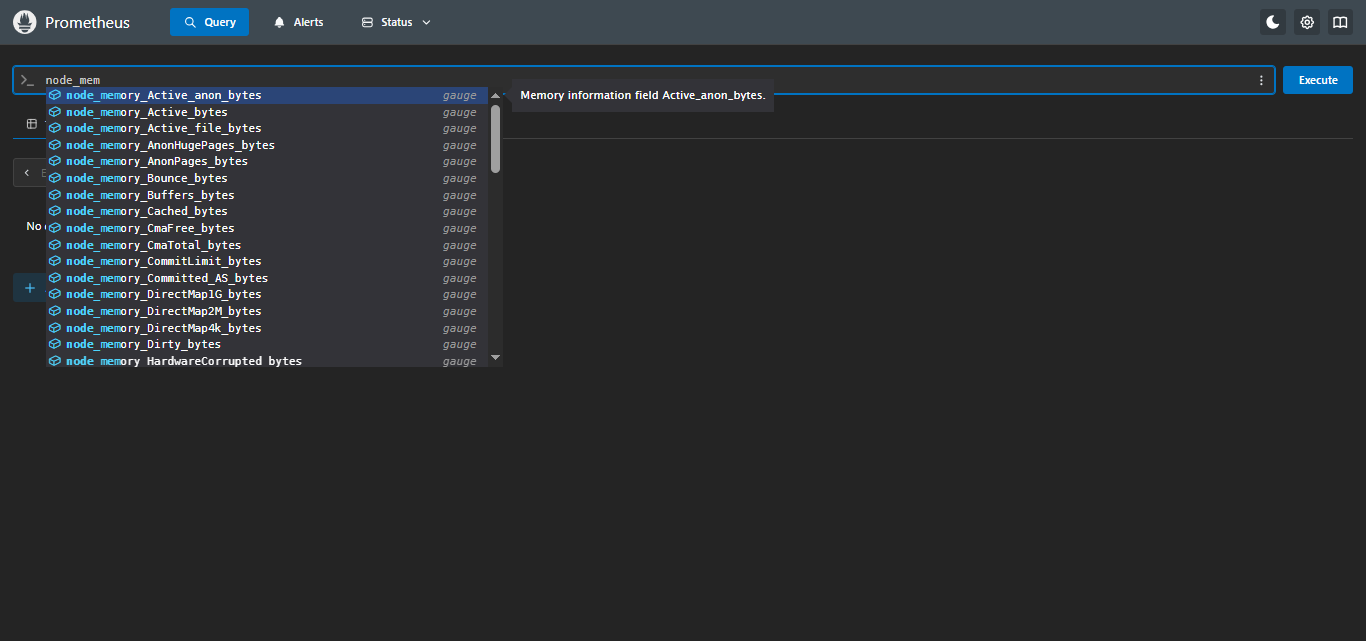
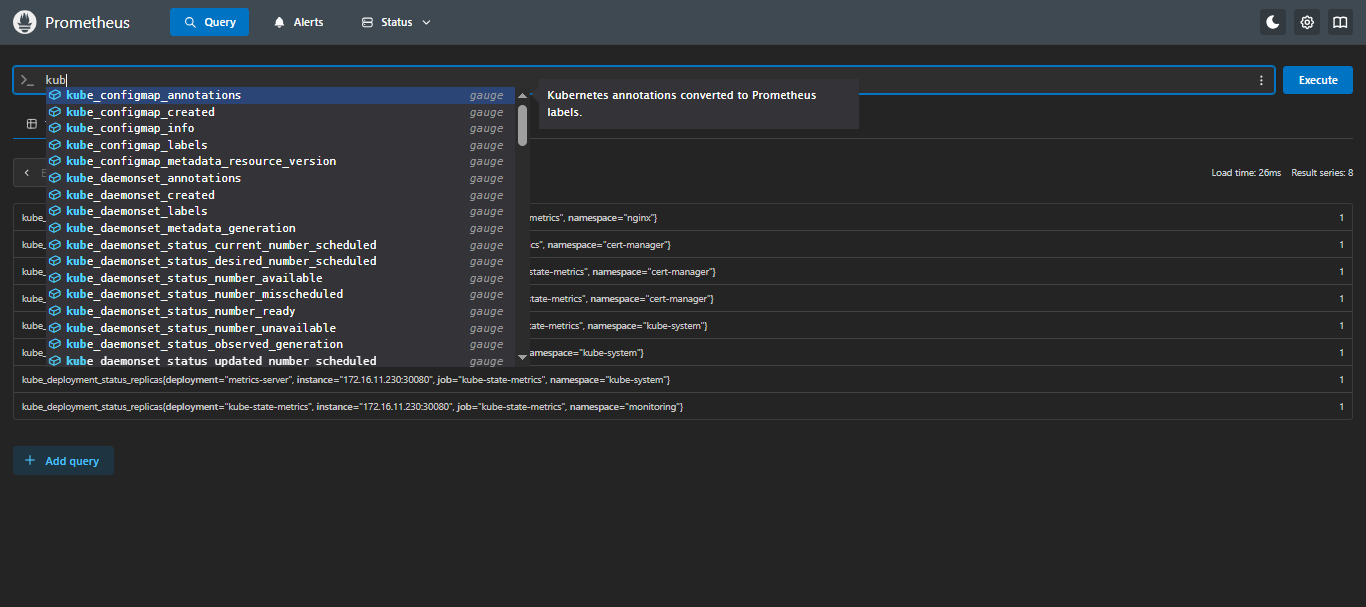
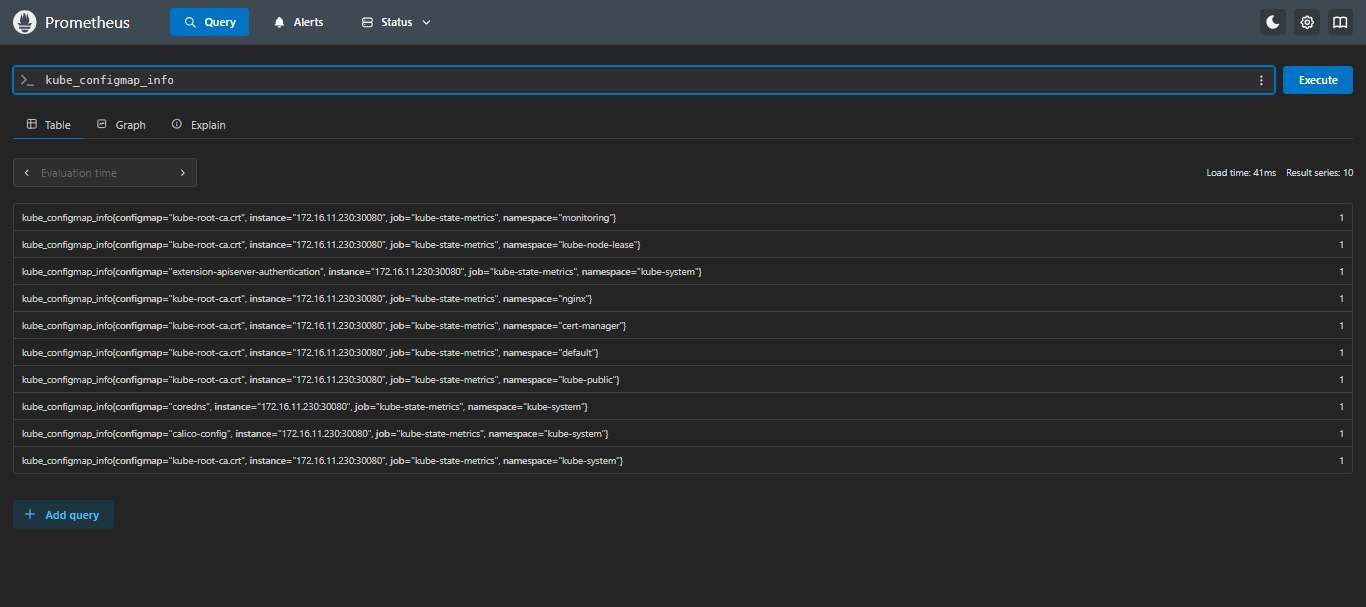
6.5 检查 Prometheus 是否支持 kubernetes 的 PromQL
在
Prometheus页面的Query输入kube,只要可以出现kube_*并可以查出来就没问题;
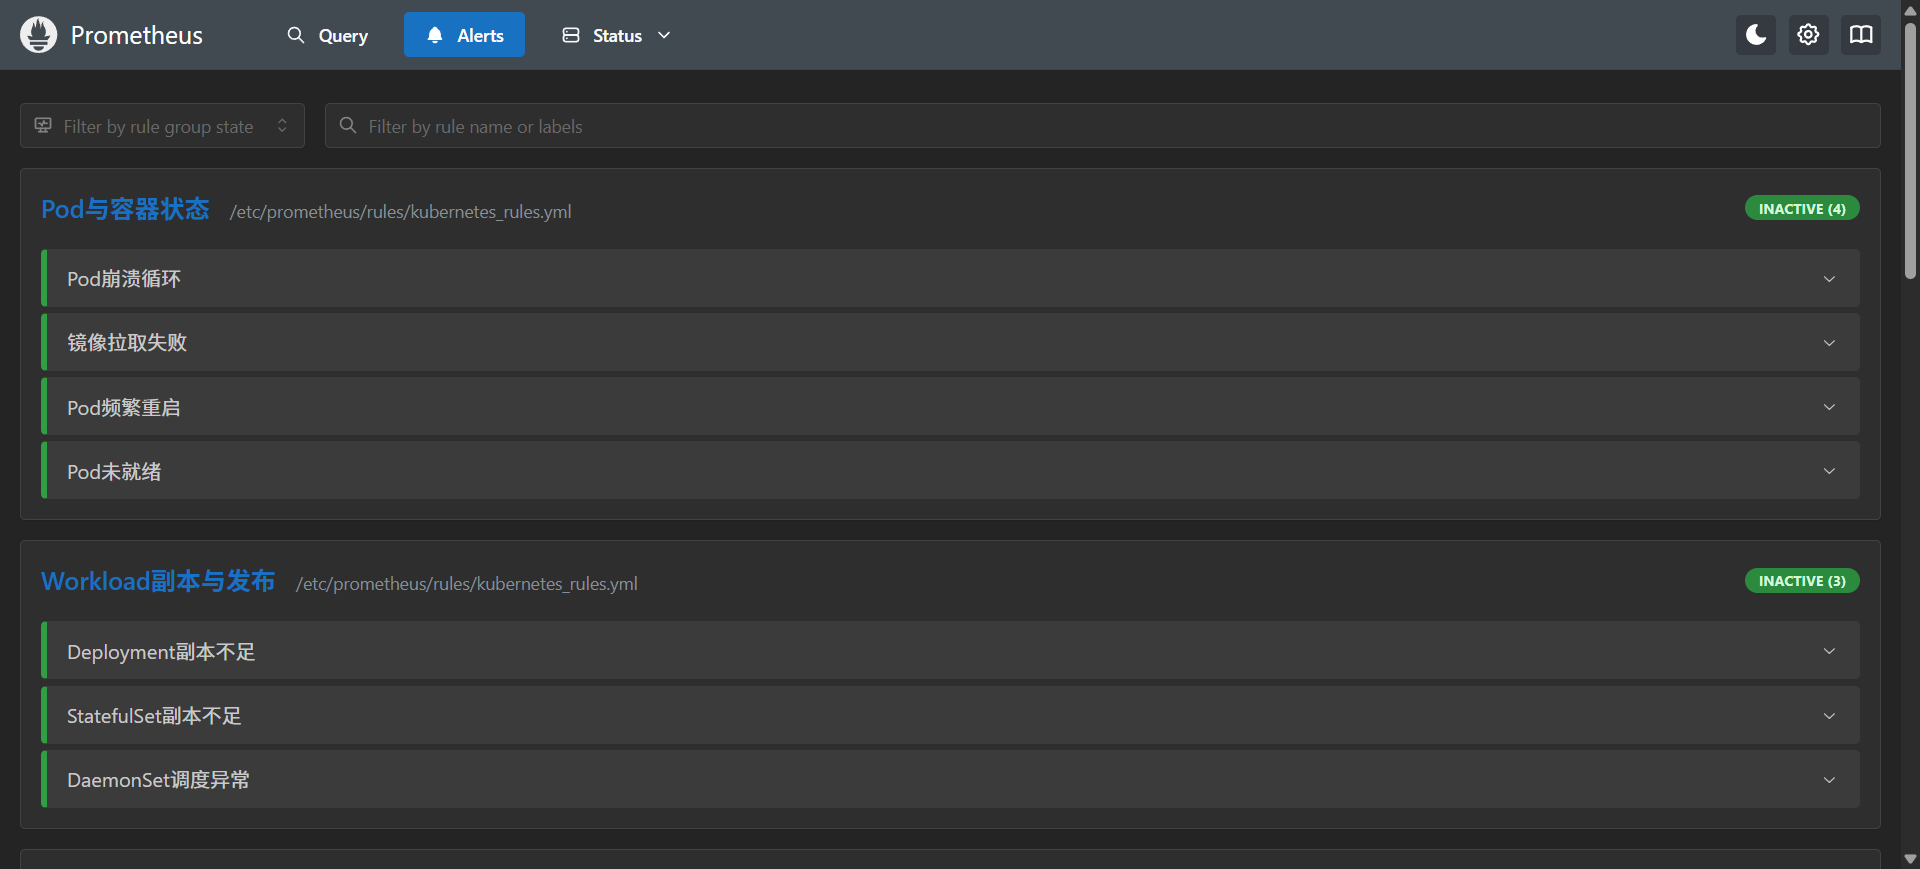
七、添加告警规则
7.1 创建告警规则 - ConfigMap
vi kubernetes_rules.yml
注意:
severity参数的值建议使用英文,这里为了演示采用了中文,如果需要用中文也可以,alertmanager配置中配置路由和静默等相关severity请更换为对应中文;
- 严重:
critical- 警告:
warning
apiVersion: v1
kind: ConfigMap
metadata:
  name: prometheus-kubernetes-rules-configmap
  namespace: monitoring
data:
  kubernetes_rules.yml: |
    groups:

      # =========================
      # 0) 基础服务状态(up)
      # =========================
      - name: 抓取指标服务状态
        rules:

          - alert: 抓取指标服务状态
            expr: up == 0
            for: 5m
            labels:
              severity: 严重
            annotations:
              summary: "IP为 {{ $labels.instance }} 的 {{ $labels.job }} 服务超过5分钟无法连接"
              description: "IP为 {{ $labels.instance }} 的 {{ $labels.job }} 服务超过5分钟无法连接,请检查服务状态"

      # =========================
      # 1) Kubernetes 核心服务(systemd)
      # =========================
      - name: kubernetes核心服务状态
        rules:

          - alert: docker服务宕机
            expr: node_systemd_unit_state{name="docker.service",state="active"} == 0
            for: 1m
            labels:
              severity: 严重
            annotations:
              summary: "IP为 {{ $labels.instance }} 的 docker 服务已停止"
              description: "IP为 {{ $labels.instance }} 的 docker 服务当前为非激活状态,请立即检查 Docker 服务状态。"

          - alert: containerd服务宕机
            expr: node_systemd_unit_state{name="containerd.service",state="active"} == 0
            for: 1m
            labels:
              severity: 严重
            annotations:
              summary: "IP为 {{ $labels.instance }} 的 containerd 服务已停止"
              description: "IP为 {{ $labels.instance }} 的 containerd 服务当前为非激活状态,请立即检查 containerd 服务状态。"

          - alert: etcd服务宕机
            expr: node_systemd_unit_state{name="etcd.service",state="active"} == 0
            for: 1m
            labels:
              severity: 严重
            annotations:
              summary: "IP为 {{ $labels.instance }} 的 etcd 服务已停止"
              description: "IP为 {{ $labels.instance }} 的 etcd 服务当前为非激活状态,请立即检查 etcd 及集群健康,防止数据不一致或集群无法选主。"

          - alert: kubeApiserver服务宕机
            expr: node_systemd_unit_state{name="kube-apiserver.service",state="active"} == 0
            for: 1m
            labels:
              severity: 严重
            annotations:
              summary: "IP为 {{ $labels.instance }} 的 kube-apiserver 服务已停止"
              description: "IP为 {{ $labels.instance }} 的 kube-apiserver 服务当前为非激活状态,将导致整个集群 API 不可用,请立即排查。"

          - alert: kubeControllerManager服务宕机
            expr: node_systemd_unit_state{name="kube-controller-manager.service",state="active"} == 0
            for: 1m
            labels:
              severity: 严重
            annotations:
              summary: "IP为 {{ $labels.instance }} 的 kube-controller-manager 服务已停止"
              description: "IP为 {{ $labels.instance }} 的 kube-controller-manager 服务当前为非激活状态,将导致副本控制器、节点控制器等无法工作,请立即修复。"

          - alert: kubeScheduler服务宕机
            expr: node_systemd_unit_state{name="kube-scheduler.service",state="active"} == 0
            for: 1m
            labels:
              severity: 严重
            annotations:
              summary: "IP为 {{ $labels.instance }} 的 kube-scheduler 服务已停止"
              description: "IP为 {{ $labels.instance }} 的 kube-scheduler 服务当前为非激活状态,将导致 Pod 无法被调度到新节点,请立即检查。"

          - alert: kubelet服务宕机
            expr: node_systemd_unit_state{name="kubelet.service",state="active"} == 0
            for: 1m
            labels:
              severity: 严重
            annotations:
              summary: "IP为 {{ $labels.instance }} 的 kubelet 服务已停止"
              description: "IP为 {{ $labels.instance }} 的 kubelet 服务当前为非激活状态,将导致该节点 Pod 生命周期无法管理,请立即恢复 kubelet。"

          - alert: kubeProxy服务宕机
            expr: node_systemd_unit_state{name="kube-proxy.service",state="active"} == 0
            for: 1m
            labels:
              severity: 严重
            annotations:
              summary: "IP为 {{ $labels.instance }} 的 kube-proxy 服务已停止"
              description: "IP为 {{ $labels.instance }} 的 kube-proxy 服务当前为非激活状态,将导致该节点服务流量无法转发,请立即检查。"

          - alert: chronyd服务宕机
            expr: node_systemd_unit_state{name=~"chronyd.service|chrony.service",state="active"} == 0
            for: 5m
            labels:
              severity: 警告
            annotations:
              summary: "IP为 {{ $labels.instance }} 的时间同步服务已停止"
              description: "时间不同步会引发证书校验、etcd 选主、日志对齐等问题,建议尽快恢复 chrony/ntp。"

      # =========================
      # 2) 节点资源与容量(带当前值)
      # =========================
      - name: 节点资源与容量
        rules:

          - alert: 节点CPU使用率过高
            expr: (1 - avg by (instance) (rate(node_cpu_seconds_total{mode="idle"}[5m]))) * 100 > 90
            for: 5m
            labels:
              severity: 警告
            annotations:
              summary: 'IP为 {{ $labels.instance }} 的 CPU 使用率过高'
              description: '当前CPU使用率为: {{ printf "%.2f" $value }}%,建议: 排查热点进程/Pod,或扩容节点资源。'

          - alert: 节点CPU使用率极高
            expr: (1 - avg by (instance) (rate(node_cpu_seconds_total{mode="idle"}[5m]))) * 100 > 97
            for: 5m
            labels:
              severity: 严重
            annotations:
              summary: 'IP为 {{ $labels.instance }} 的 CPU 使用率极高'
              description: '当前CPU使用率为: {{ printf "%.2f" $value }}%,建议: 立即定位热点,避免 kubelet/关键组件被拖慢。'

          - alert: 节点内存使用率过高
            expr: (1 - (node_memory_MemAvailable_bytes / node_memory_MemTotal_bytes)) * 100 > 90
            for: 10m
            labels:
              severity: 警告
            annotations:
              summary: 'IP为 {{ $labels.instance }} 的内存使用率过高'
              description: '当前内存使用率为: {{ printf "%.2f" $value }}%,建议: 排查内存大户进程/Pod,必要时提升内存或调整限额。'

          - alert: 节点内存使用率极高
            expr: (1 - (node_memory_MemAvailable_bytes / node_memory_MemTotal_bytes)) * 100 > 97
            for: 5m
            labels:
              severity: 严重
            annotations:
              summary: 'IP为 {{ $labels.instance }} 的内存压力极高'
              description: '当前内存使用率为: {{ printf "%.2f" $value }}%,建议: 高风险 OOM/驱逐,立即处理(释放内存/扩容/降载)。'

          - alert: 节点磁盘空间不足
            expr: (1 - node_filesystem_avail_bytes{fstype!~"tmpfs|overlay|squashfs|ramfs",mountpoint!="/media/cdrom"} / node_filesystem_size_bytes{fstype!~"tmpfs|overlay|squashfs|ramfs",mountpoint!="/media/cdrom"}) * 100 > 90
            for: 10m
            labels:
              severity: 警告
            annotations:
              summary: 'IP为 {{ $labels.instance }} 的磁盘使用率过高'
              description: '告警磁盘: {{ $labels.mountpoint }};当前使用率: {{ printf "%.2f" $value }}%;建议: 清理日志/容器镜像/临时文件,或扩容磁盘。'

          - alert: 节点磁盘空间极低
            expr: (1 - node_filesystem_avail_bytes{fstype!~"tmpfs|overlay|squashfs|ramfs",mountpoint!="/media/cdrom"} / node_filesystem_size_bytes{fstype!~"tmpfs|overlay|squashfs|ramfs",mountpoint!="/media/cdrom"}) * 100 > 95
            for: 5m
            labels:
              severity: 严重
            annotations:
              summary: 'IP为 {{ $labels.instance }} 的磁盘使用率极高'
              description: '告警磁盘: {{ $labels.mountpoint }};当前使用率: {{ printf "%.2f" $value }}%;建议: 立即处理,避免 kubelet/容器运行时写入失败导致节点异常。'

          - alert: 节点Inode不足
            expr: (1 - node_filesystem_files_free{fstype!~"tmpfs|overlay|squashfs|ramfs"} / node_filesystem_files{fstype!~"tmpfs|overlay|squashfs|ramfs"}) * 100 > 90
            for: 10m
            labels:
              severity: 警告
            annotations:
              summary: 'IP为 {{ $labels.instance }} 的 Inode 使用率过高'
              description: '告警磁盘: {{ $labels.mountpoint }};当前Inode使用率: {{ printf "%.2f" $value }}%;建议: 清理小文件(日志/缓存/容器层),避免创建文件失败。'

          - alert: 节点负载过高
            expr: (node_load1 / count without(cpu, mode) (node_cpu_seconds_total{mode="idle"})) > 2
            for: 10m
            labels:
              severity: 警告
            annotations:
              summary: 'IP为 {{ $labels.instance }} 的系统负载过高'
              description: '当前 Load1/CPU核数为: {{ printf "%.2f" $value }};建议: 可能存在 IO/CPU 饱和,排查 top、iostat、容器限流与磁盘问题。'


      # =========================
      # 3) 节点网络与系统资源(连接、句柄、错误包)
      # =========================
      - name: 节点网络与系统资源
        rules:

          - alert: 节点网络接收错误过多
            expr: rate(node_network_receive_errs_total{device!~"lo|veth.*|docker.*|cni.*|flannel.*|cali.*"}[5m]) > 10
            for: 10m
            labels:
              severity: 警告
            annotations:
              summary: 'IP为 {{ $labels.instance }} 的网络接收错误过多'
              description: '网卡: {{ $labels.device }};当前每秒接收错误: {{ printf "%.2f" $value }};建议: 排查物理链路/网卡驱动/丢包与交换机端口。'

          - alert: 节点网络发送错误过多
            expr: rate(node_network_transmit_errs_total{device!~"lo|veth.*|docker.*|cni.*|flannel.*|cali.*"}[5m]) > 10
            for: 10m
            labels:
              severity: 警告
            annotations:
              summary: 'IP为 {{ $labels.instance }} 的网络发送错误过多'
              description: '网卡: {{ $labels.device }};当前每秒发送错误: {{ printf "%.2f" $value }};建议: 排查链路质量/拥塞/驱动与 MTU 配置。'

          - alert: 节点conntrack使用率过高
            expr: (node_nf_conntrack_entries / node_nf_conntrack_entries_limit) * 100 > 80
            for: 10m
            labels:
              severity: 警告
            annotations:
              summary: 'IP为 {{ $labels.instance }} 的 conntrack 使用率过高'
              description: '当前使用率: {{ printf "%.2f" $value }}%;建议: 检查连接风暴/异常流量,必要时调大 nf_conntrack_max。'

          - alert: 节点文件句柄使用率过高
            expr: (node_filefd_allocated / node_filefd_maximum) * 100 > 80
            for: 10m
            labels:
              severity: 警告
            annotations:
              summary: 'IP为 {{ $labels.instance }} 的文件句柄使用率过高'
              description: '当前使用率: {{ printf "%.2f" $value }}%;建议: 排查打开文件数异常的进程/容器,必要时提升系统限制。'


      # ==================================================
      # 4) Pod/容器层(需要 kube-state-metrics)
      # ==================================================
      - name: Pod与容器状态
        rules:

          - alert: Pod崩溃循环
            expr: kube_pod_container_status_waiting_reason{reason="CrashLoopBackOff"} == 1
            for: 5m
            labels: { severity: 严重 }
            annotations:
              summary: 'Pod CrashLoopBackOff'
              description: 'namespace={{ $labels.namespace }} pod={{ $labels.pod }} container={{ $labels.container }} 发生 CrashLoopBackOff。'

          - alert: 镜像拉取失败
            expr: kube_pod_container_status_waiting_reason{reason=~"ImagePullBackOff|ErrImagePull"} == 1
            for: 5m
            labels: { severity: 严重 }
            annotations:
              summary: '镜像拉取失败'
              description: 'namespace={{ $labels.namespace }} pod={{ $labels.pod }} container={{ $labels.container }} 镜像拉取失败。'

          - alert: Pod频繁重启
            expr: increase(kube_pod_container_status_restarts_total[30m]) > 3
            for: 5m
            labels: { severity: 警告 }
            annotations:
              summary: 'Pod重启次数过多'
              description: 'namespace={{ $labels.namespace }} pod={{ $labels.pod }} container={{ $labels.container }} 30分钟内重启>3次。'

          - alert: Pod未就绪
            expr: kube_pod_status_ready{condition="true"} == 0 and kube_pod_status_phase{phase=~"Running|Pending|Unknown"} == 1
            for: 10m
            labels: { severity: 警告 }
            annotations:
              summary: 'Pod长时间未Ready'
              description: 'namespace={{ $labels.namespace }} pod={{ $labels.pod }} 持续10分钟未Ready,请检查探针/依赖/资源。'


      # ==================================================
      # 5) Workload 层(Deployment/StatefulSet/DaemonSet)
      # ==================================================
      - name: Workload副本与发布
        rules:

          - alert: Deployment副本不足
            expr: kube_deployment_status_replicas_available < kube_deployment_spec_replicas
            for: 10m
            labels: { severity: 警告 }
            annotations:
              summary: 'Deployment副本不足'
              description: 'namespace={{ $labels.namespace }} deployment={{ $labels.deployment }} 可用副本低于期望值。'

          - alert: StatefulSet副本不足
            expr: kube_statefulset_status_replicas_ready < kube_statefulset_spec_replicas
            for: 10m
            labels: { severity: 警告 }
            annotations:
              summary: 'StatefulSet副本不足'
              description: 'namespace={{ $labels.namespace }} statefulset={{ $labels.statefulset }} 就绪副本不足。'

          - alert: DaemonSet调度异常
            expr: kube_daemonset_status_number_misscheduled > 0 or kube_daemonset_status_desired_number_scheduled != kube_daemonset_status_current_number_scheduled
            for: 10m
            labels: { severity: 警告 }
            annotations:
              summary: 'DaemonSet调度异常'
              description: 'namespace={{ $labels.namespace }} daemonset={{ $labels.daemonset }} 调度数量不一致或存在误调度。'


      # ==================================================
      # 6) 调度与容量(Pending/资源逼近)
      # ==================================================
      - name: 调度与容量风险
        rules:

          - alert: Pod长时间Pending
            expr: kube_pod_status_phase{phase="Pending"} == 1
            for: 10m
            labels: { severity: 警告 }
            annotations:
              summary: 'Pod长时间Pending'
              description: 'namespace={{ $labels.namespace }} pod={{ $labels.pod }} Pending超过10分钟,可能资源不足或约束不满足。'

          - alert: 集群CPURequests接近耗尽
            expr: (sum(kube_pod_container_resource_requests{resource="cpu"}) / sum(kube_node_status_allocatable{resource="cpu"})) * 100 > 90
            for: 10m
            labels: { severity: 警告 }
            annotations:
              summary: '集群CPU requests接近耗尽'
              description: '当前CPU requests占比: {{ printf "%.2f" $value }}%,阈值: 90%,持续: 10分钟。'

          - alert: 集群内存Requests接近耗尽
            expr: (sum(kube_pod_container_resource_requests{resource="memory"}) / sum(kube_node_status_allocatable{resource="memory"})) * 100 > 90
            for: 10m
            labels: { severity: 警告 }
            annotations:
              summary: '集群内存 requests接近耗尽'
              description: '当前内存 requests占比: {{ printf "%.2f" $value }}%,阈值: 90%,持续: 10分钟。'
7.2 部署Prometheus的告警规则
- 部署Prometheus的告警规则
kubectl apply -f kubernetes_rules.yml- 查看告警规则是否部署成功
kubectl get cm -n monitoring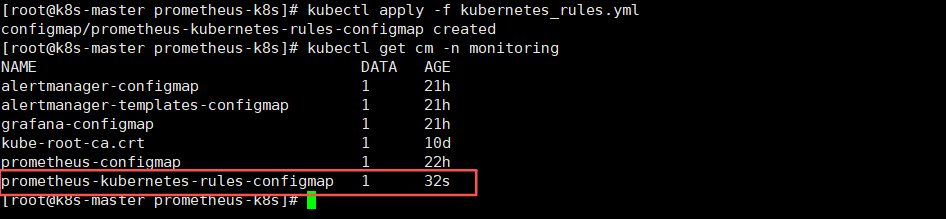
7.3 挂载告警规则到Prometheus Deployment中
修改Prometheus部署yaml,添加configmap挂载
vi prometheus-deploy.yaml
        volumeMounts:
        - name: prometheus-rules
          mountPath: /etc/prometheus/rules/

########################## 中间内容省略 ###########################

      volumes:
      - name: prometheus-rules
        configMap:
          name: prometheus-kubernetes-rules-configmap
7.4 重新加载Prometheus deployment
kubectl apply -f prometheus-deploy.yaml等待一会,进行重启服务。。。
7.5 进入Prometheus页面进行查看监控指标
node ip:30090/alerts,如下可以查看到指标则没问题